BACK TO TOP
Back to top

health

VISION

STRATEGIC VISION
(©2021 2025)
Scroll Down
Handsome young man in orange classes on clear sky background.
Beautiful young woman in orange glasses on orange background.
Single orange flower on the clear sky background.

Empowering Better Breast Cancer Outcomes:
Real-Time Analytics and Data Accessibility

A national Breast Cancer Register held a wealth of data (500 fields) crucial for improving patient outcomes, but its raw, inaccessible format severely limited its utility for clinicians, researchers, and patients. This project involved developing the strategy and human-centred design for a real-time, user-friendly analytics and visualisation dashboard.

The goal was to transform complex data into actionable insights tailored for diverse users, enhancing clinical workflows, improving health planning, and addressing equity in diagnosis, treatment, and survival.

(01)

the challenge

My Expertise:

As the Principal Experience Designer, I led the design and strategic vision for this complex, high-stakes initiative, ensuring the product met the diverse needs of its user base, from surgeons to patients.

My core expertise demonstrated included:

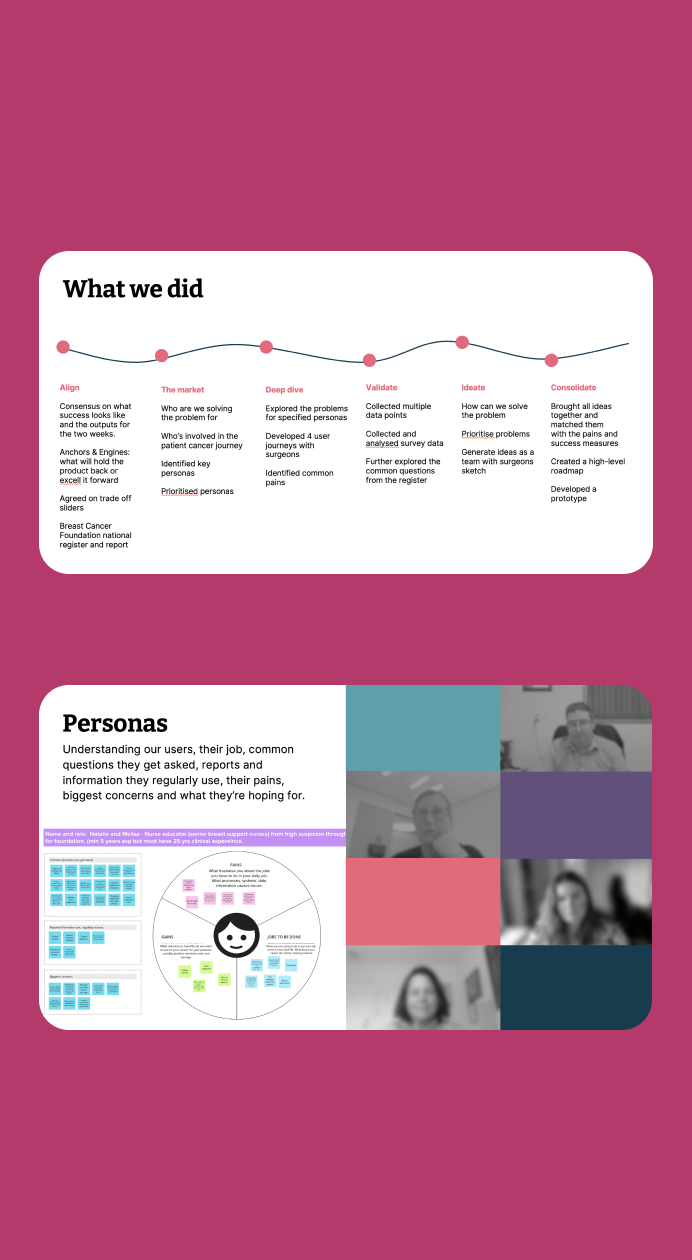
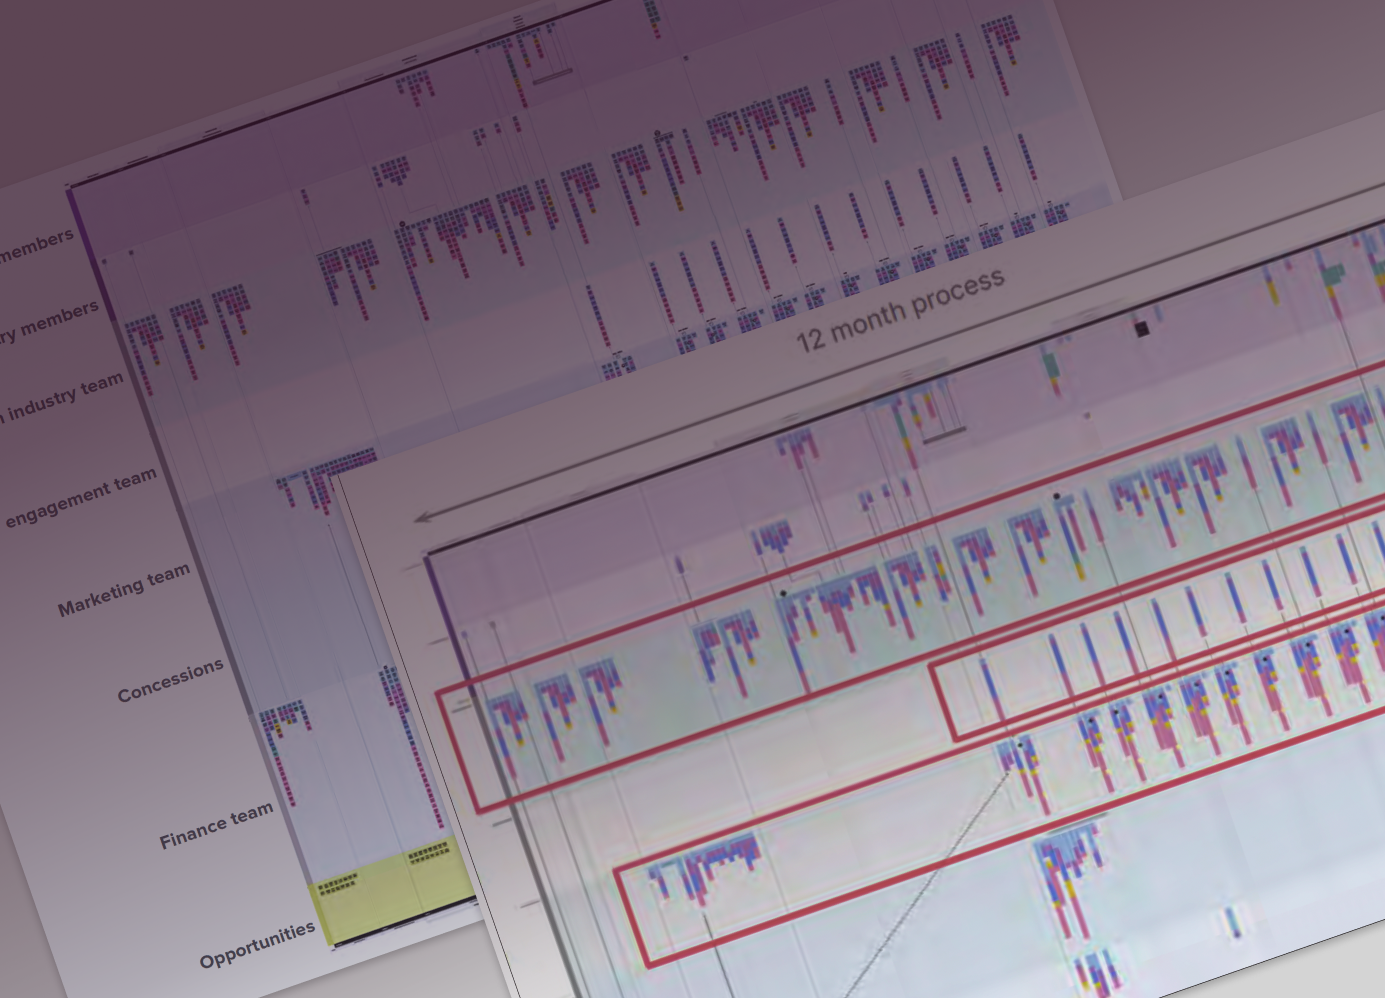
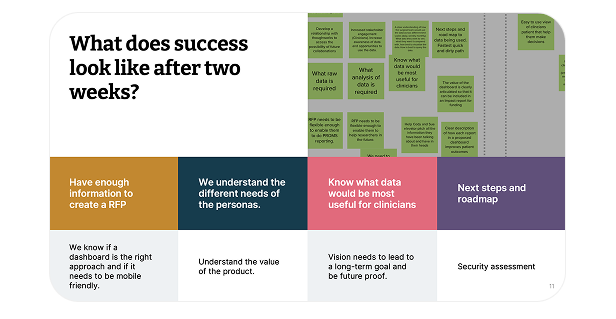
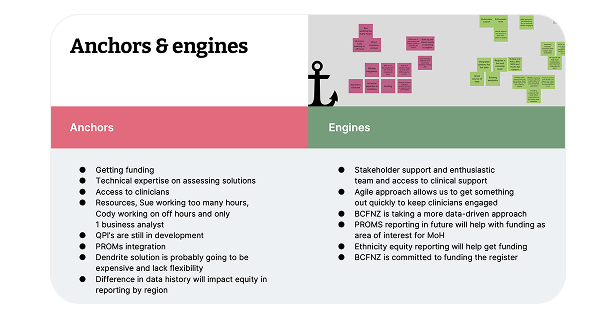
  • Complex Stakeholder Alignment: Facilitated high-stakes inception workshops, defining success metrics and trade-off sliders with executives and clinicians to balance scope and priorities against the goal of improving outcomes and equity.
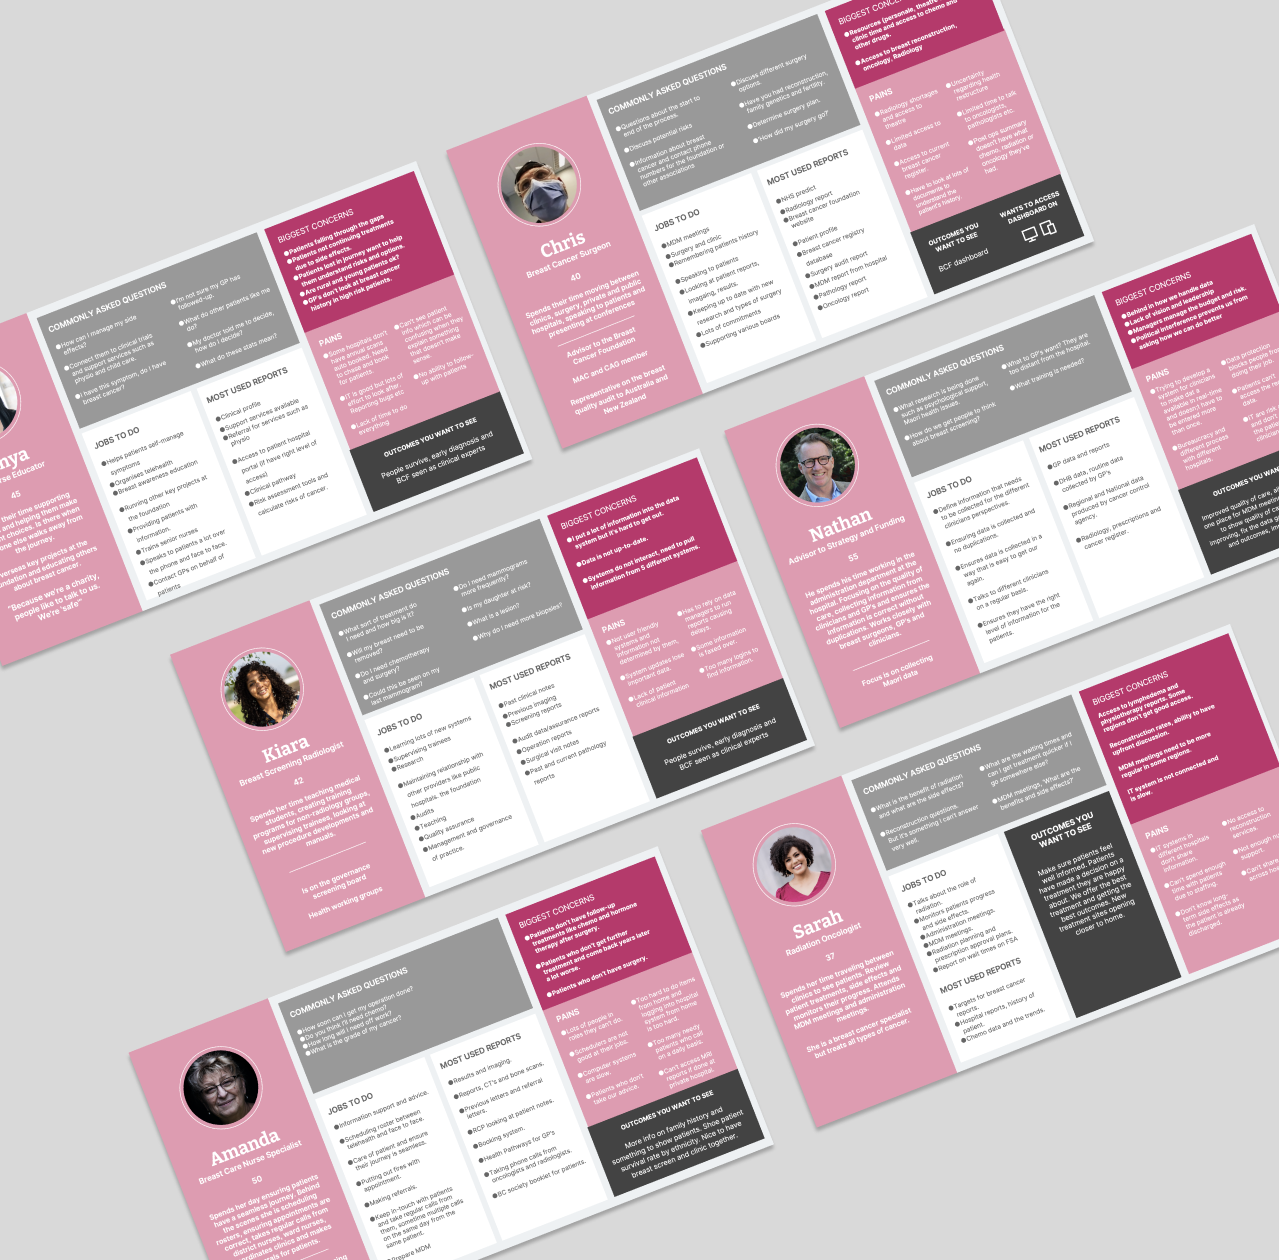
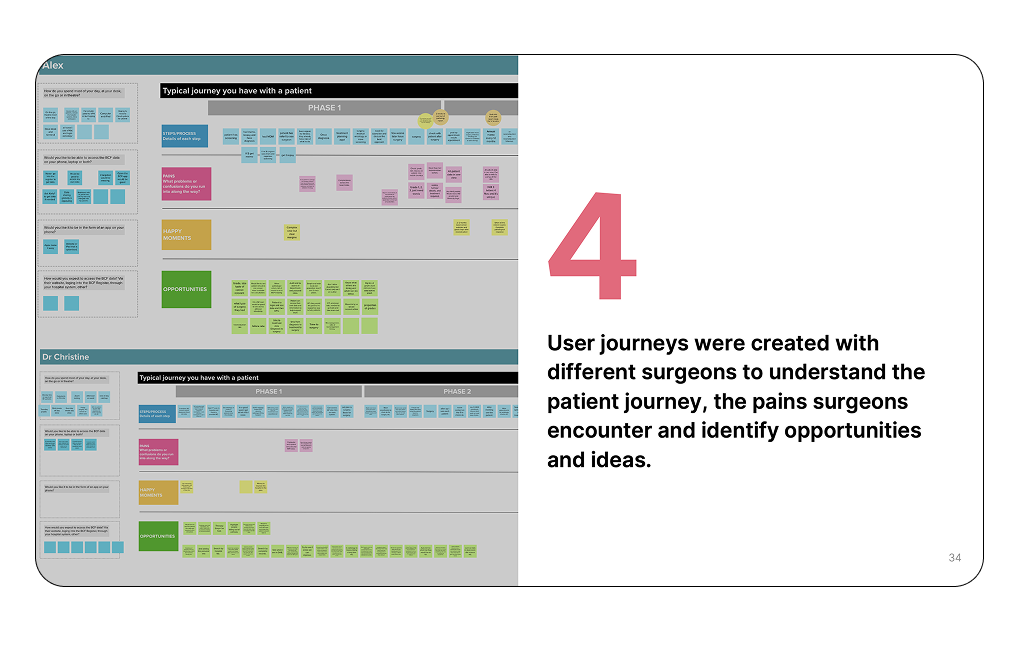
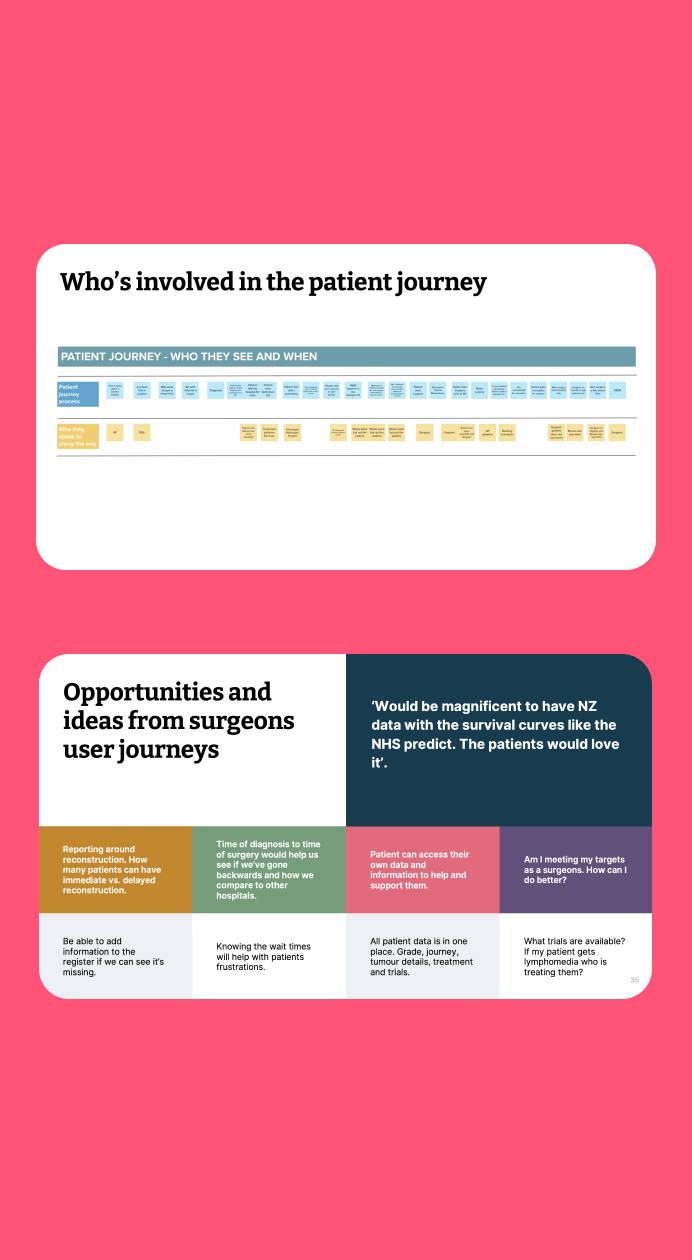
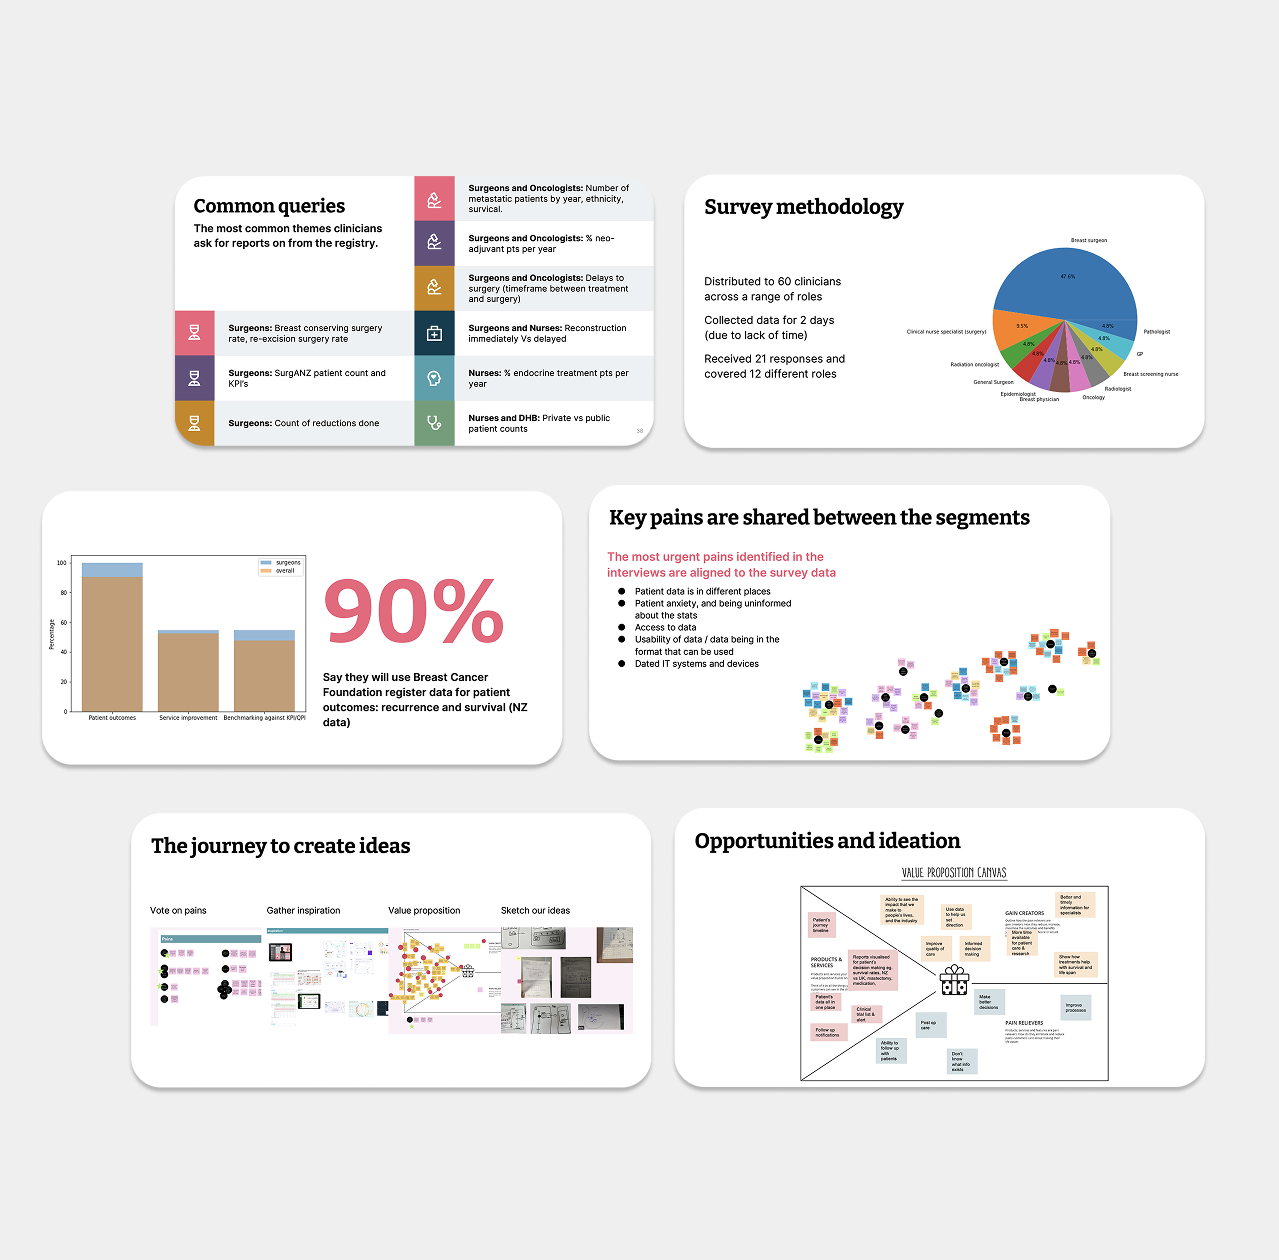
  • Deep User Research & Synthesis: Led multi-method qualitative and quantitative research (16 interviews, 21-response survey from 12 roles) in just two weeks, translating insights into four critical user journeys (e.g., patient access to data, performance benchmarking).
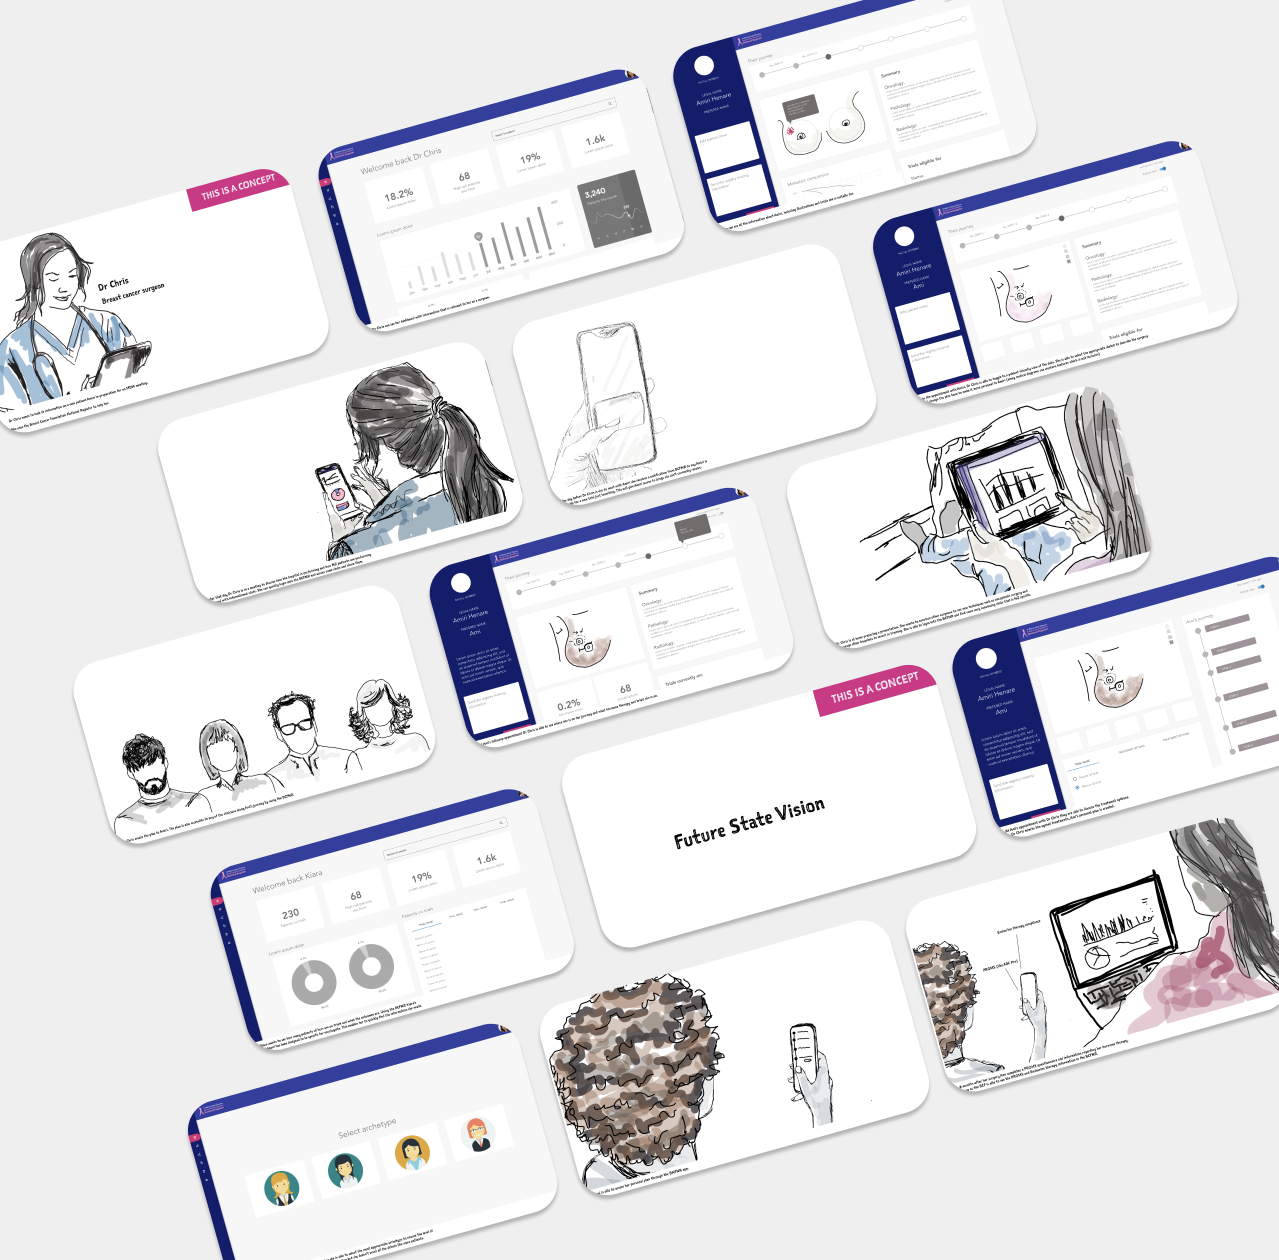
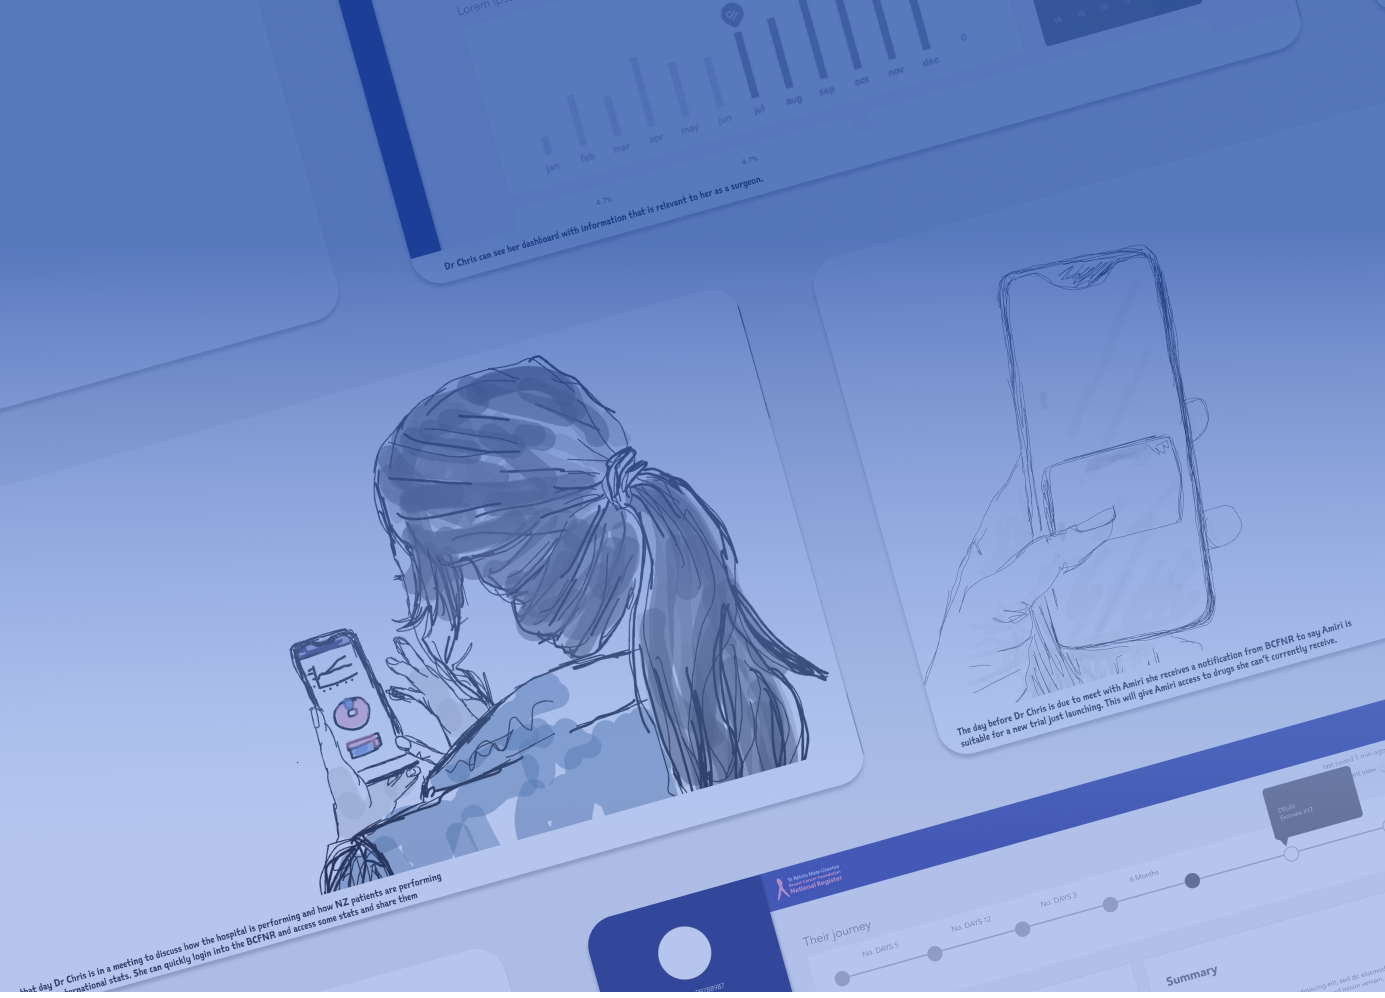
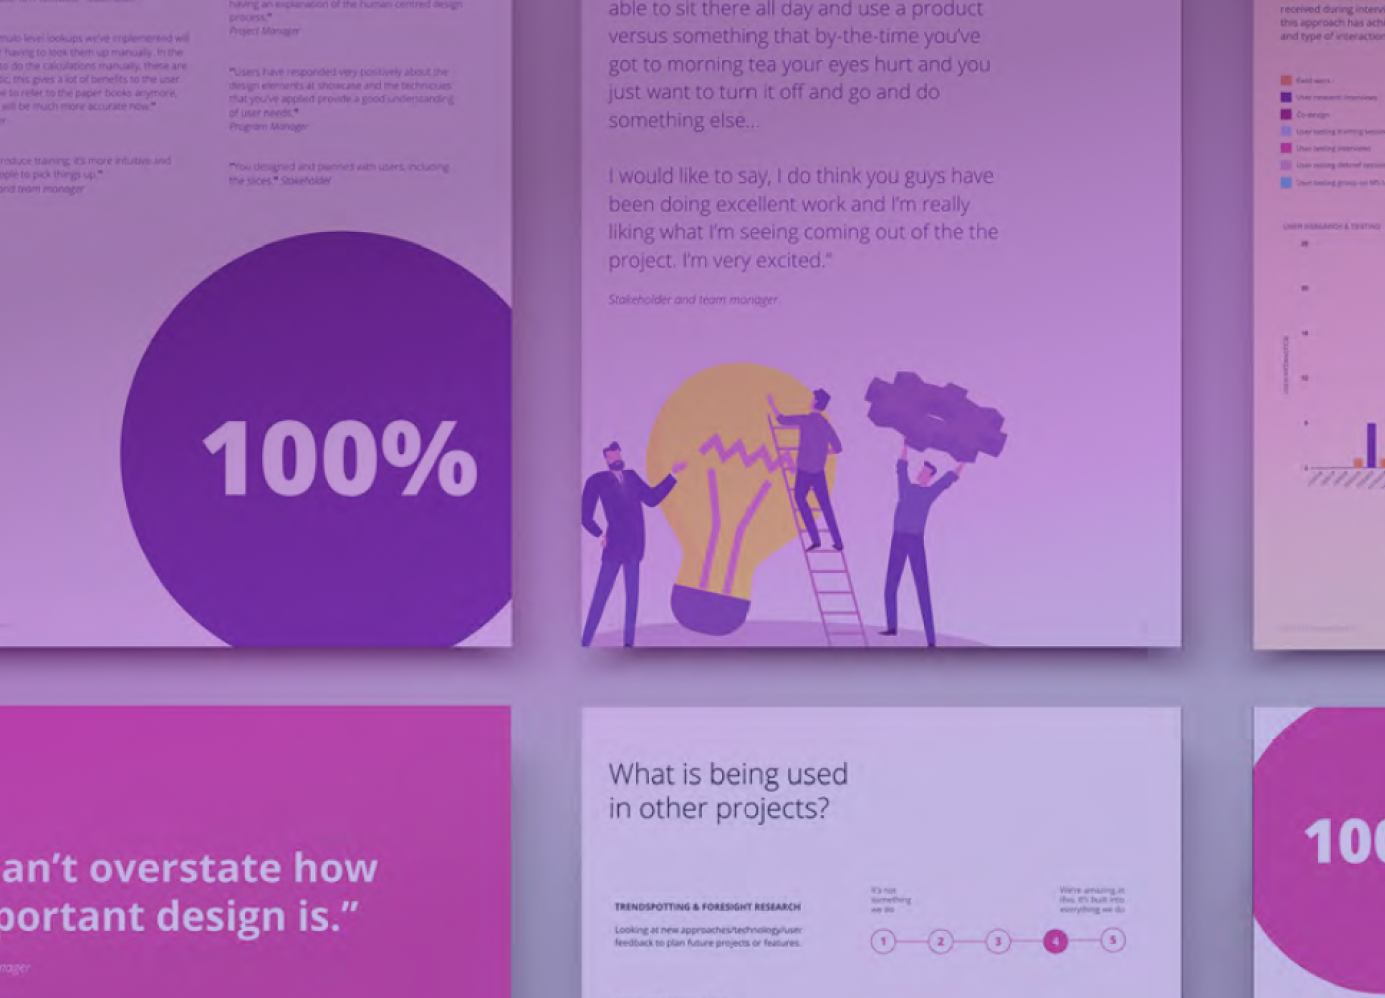
  • Strategic Storytelling: Developed a powerful storyboard-style approach for the final presentation, creating distinct narratives (clinician and patient views) that seamlessly illustrated pain points and demonstrated the product’s transformational impact and workflow integration.
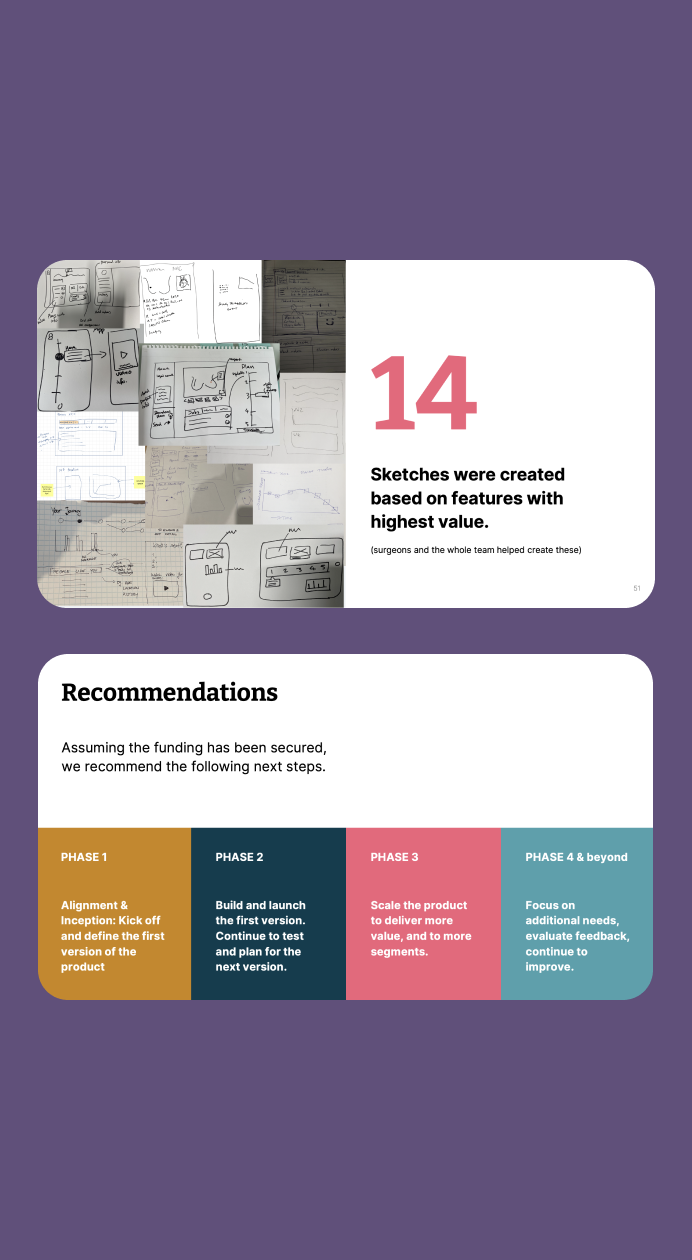
  • Value Realisation & Roadmapping: Translated extensive research and ideation into an actionable roadmap designed for "thin-slice" development, ensuring the client could test and release early, measurable value quickly.

The challenge:
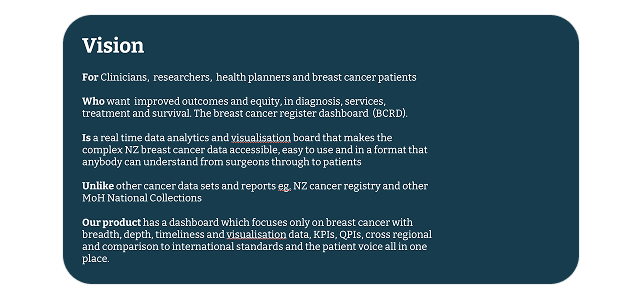
The Register’s vast data (500 fields) was locked in a raw format, preventing its use for strategic decision-making and patient empowerment.

The key challenge was:

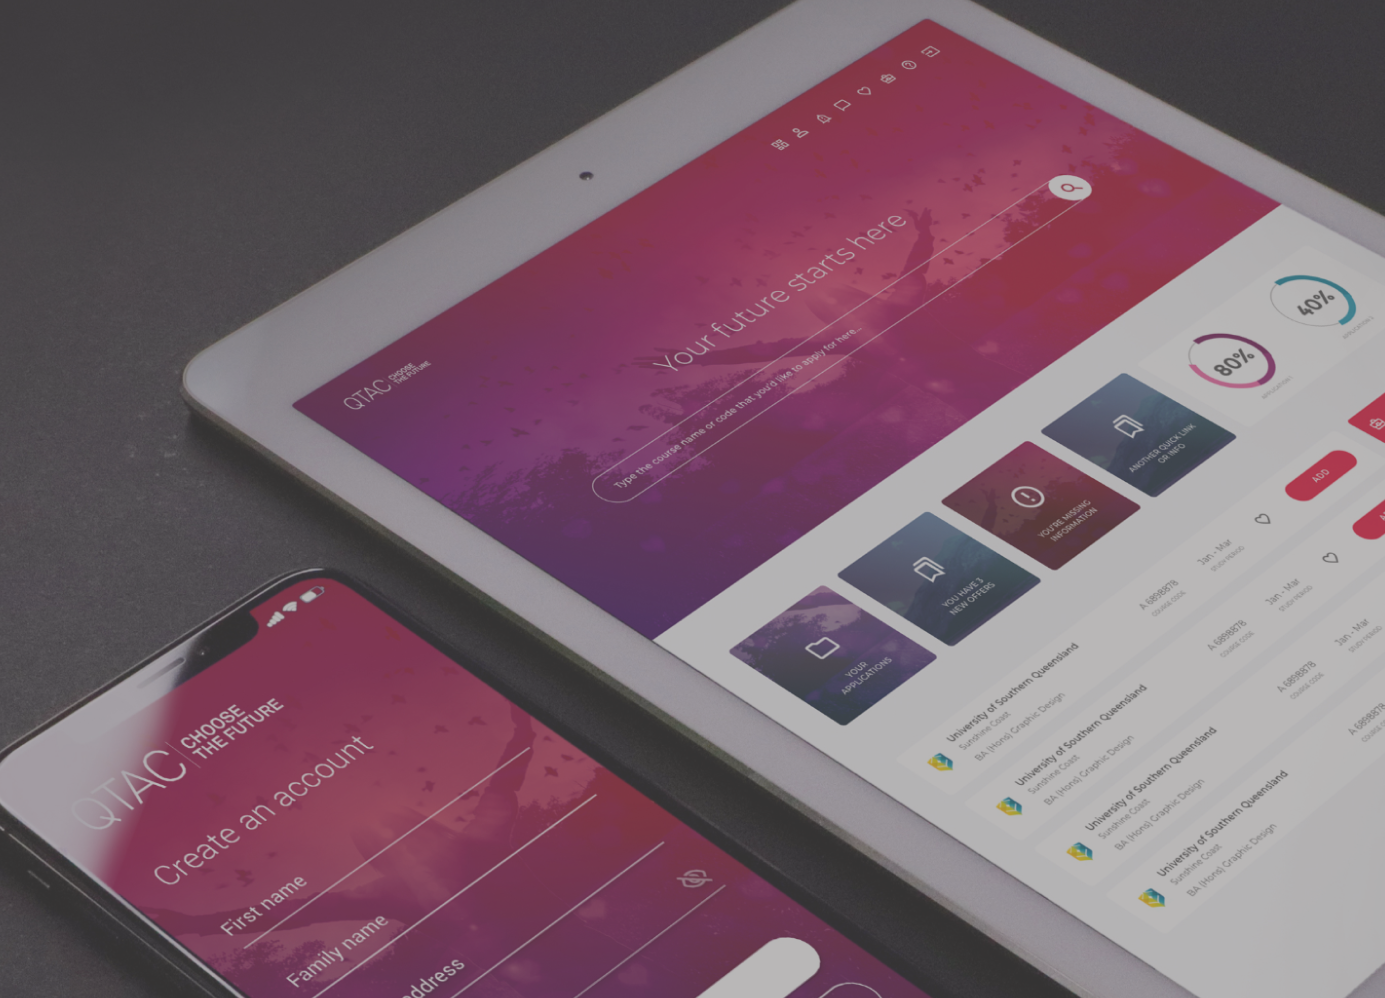
  • Accessibility & Utility: Designing a single, intuitive platform capable of serving highly diverse user groups—from surgeons needing specific Quality and Performance Indicators (QPIs) to patients needing accessible self-management tools.
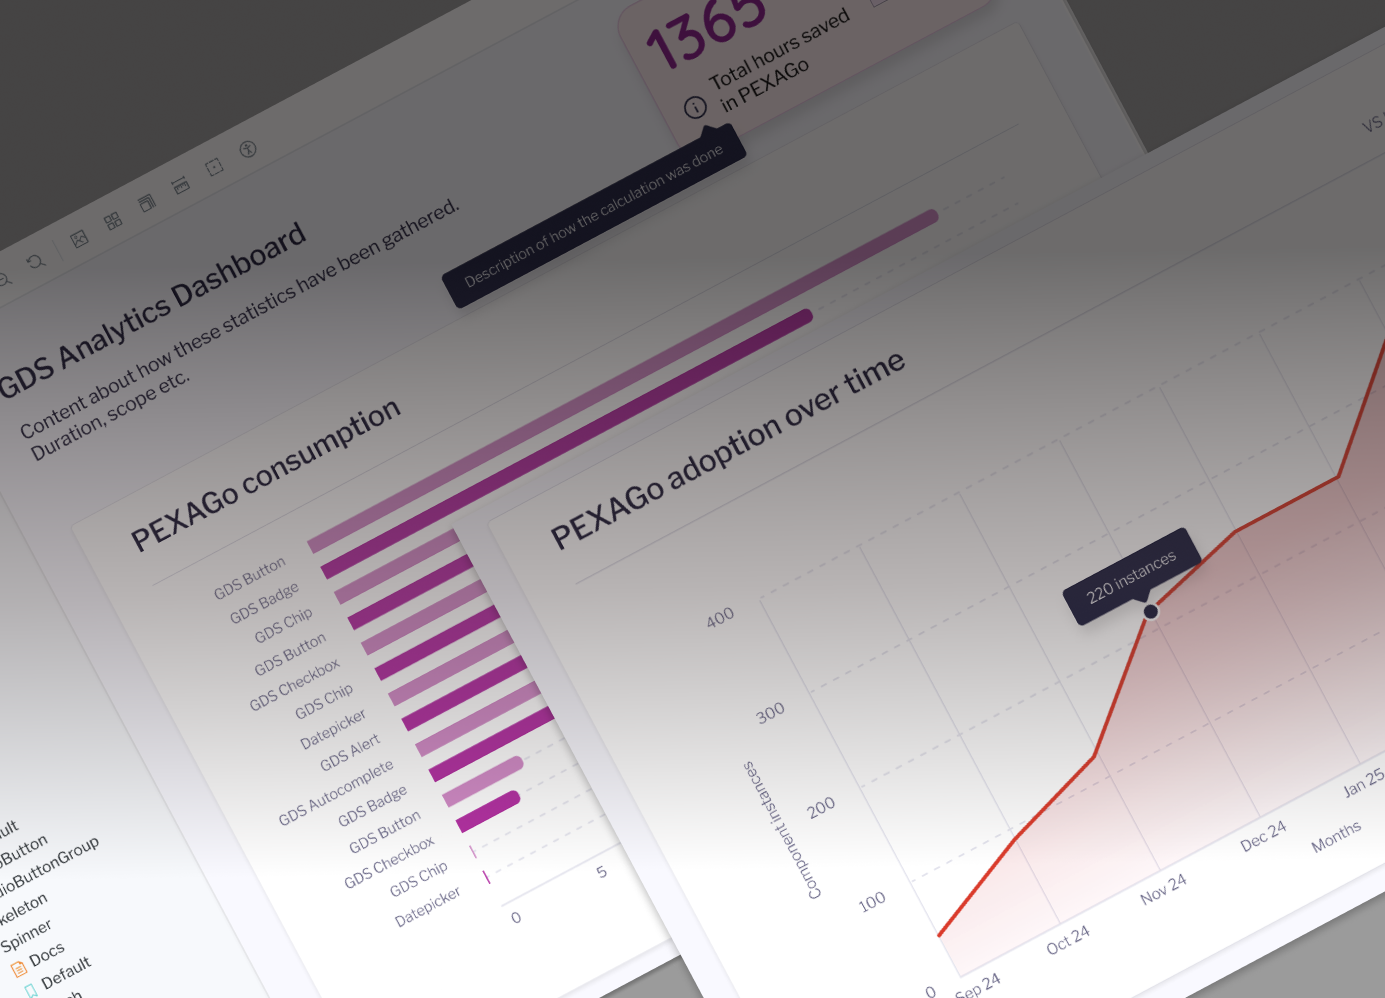
  • Actionable Insights: Moving beyond simple data display to deliver real-time analytics and visualisations that would directly enhance clinical workflows, such as identifying actionable themes like the need for faster diagnosis-to-surgery timelines.
  • Equity: Leveraging the data to address critical issues like equitable access to experimental treatments (e.g., automated trial matching).
(02)

the approach

The Approach:
My approach combined rapid, deep-dive research with collaborative ideation and a compelling strategic vision, ensuring alignment from the surgical theatre to the boardroom.

Inception & Alignment: We began with intensive workshops to define success criteria, identifying "Anchors & Engines" (barriers and drivers) and agreeing on trade-off sliders to manage scope. This ensured early alignment on the focus: the National Register’s data and reporting needs.

Rapid Validation: Over six days, we conducted qualitative research with 16 stakeholders (including surgeons and clinicians), quickly validating common pain points and identifying themes like reconstruction reporting. This was immediately backed up by a 60-person clinician survey which confirmed high demand for trial matching and patient engagement tools.

Collaborative Ideation: I led co-creation sessions with surgeons to prioritise problems and generate high-impact solutions, such as automated trial matching and patient-facing self-management tools.

Strategic Vision:
The project culminated in a strategic final presentation. I avoided standard prototypes, instead employing a storyboard-style narrative for each user segment (clinician, patient). This technique powerfully demonstrated the product's seamless integration and value, leading directly to an actionable roadmap for phased development.

(03)

the outcome

The Outcome:
The project successfully provided the organisation and its board with a clear, validated path to transform raw data into a strategic asset that will directly improve patient outcomes and operational efficiency.

Clinical Value

The design focused on integrating features (like automated trial matching) proven to improve patient outcomes, such as higher pCR rates and lower mastectomy risks for patients in neoadjuvant chemotherapy trials.

Patient Empowerment

Enabled the design of patient-facing tools for self-management, addressing research findings that engaged patients report better outcomes and fewer errors, reducing healthcare costs

Strategic Clarity

The Actionable Roadmap provided the board with a clear "thin-slice" development strategy, detailing the immediate next steps and the significant value the solution would add.

Data Accessibility

The proposed design provided an intuitive dashboard interface with real-time analytics, KPIs, QPIs, and cross-regional comparisons, transforming inaccessible data into a strategic, actionable asset.